
Real Estate Statistics
Are you ever wondering about the market? Below we break down what can sometimes be complicated to understand in our Vermont statistics. Are there other things you want to know about today’s market? Schedule an appointment with a member of our team and we’d love to tell you more.
We educate our buyers and sellers about today’s market. As a result, they are positioned to make the best decisions for their real estate transactions. For instance, if I am buying a home in Burlington, I want to know the list to sales price ratio to understand that homes are going for 98.23% of the list price. Therefore, I may not have as much negotiating power as I do in a town with a 96% list to sales price ratio. Whether you are buying or selling, in a competitive market, you want a knowledgable Realtor on your side. Let us be that Realtor for you!
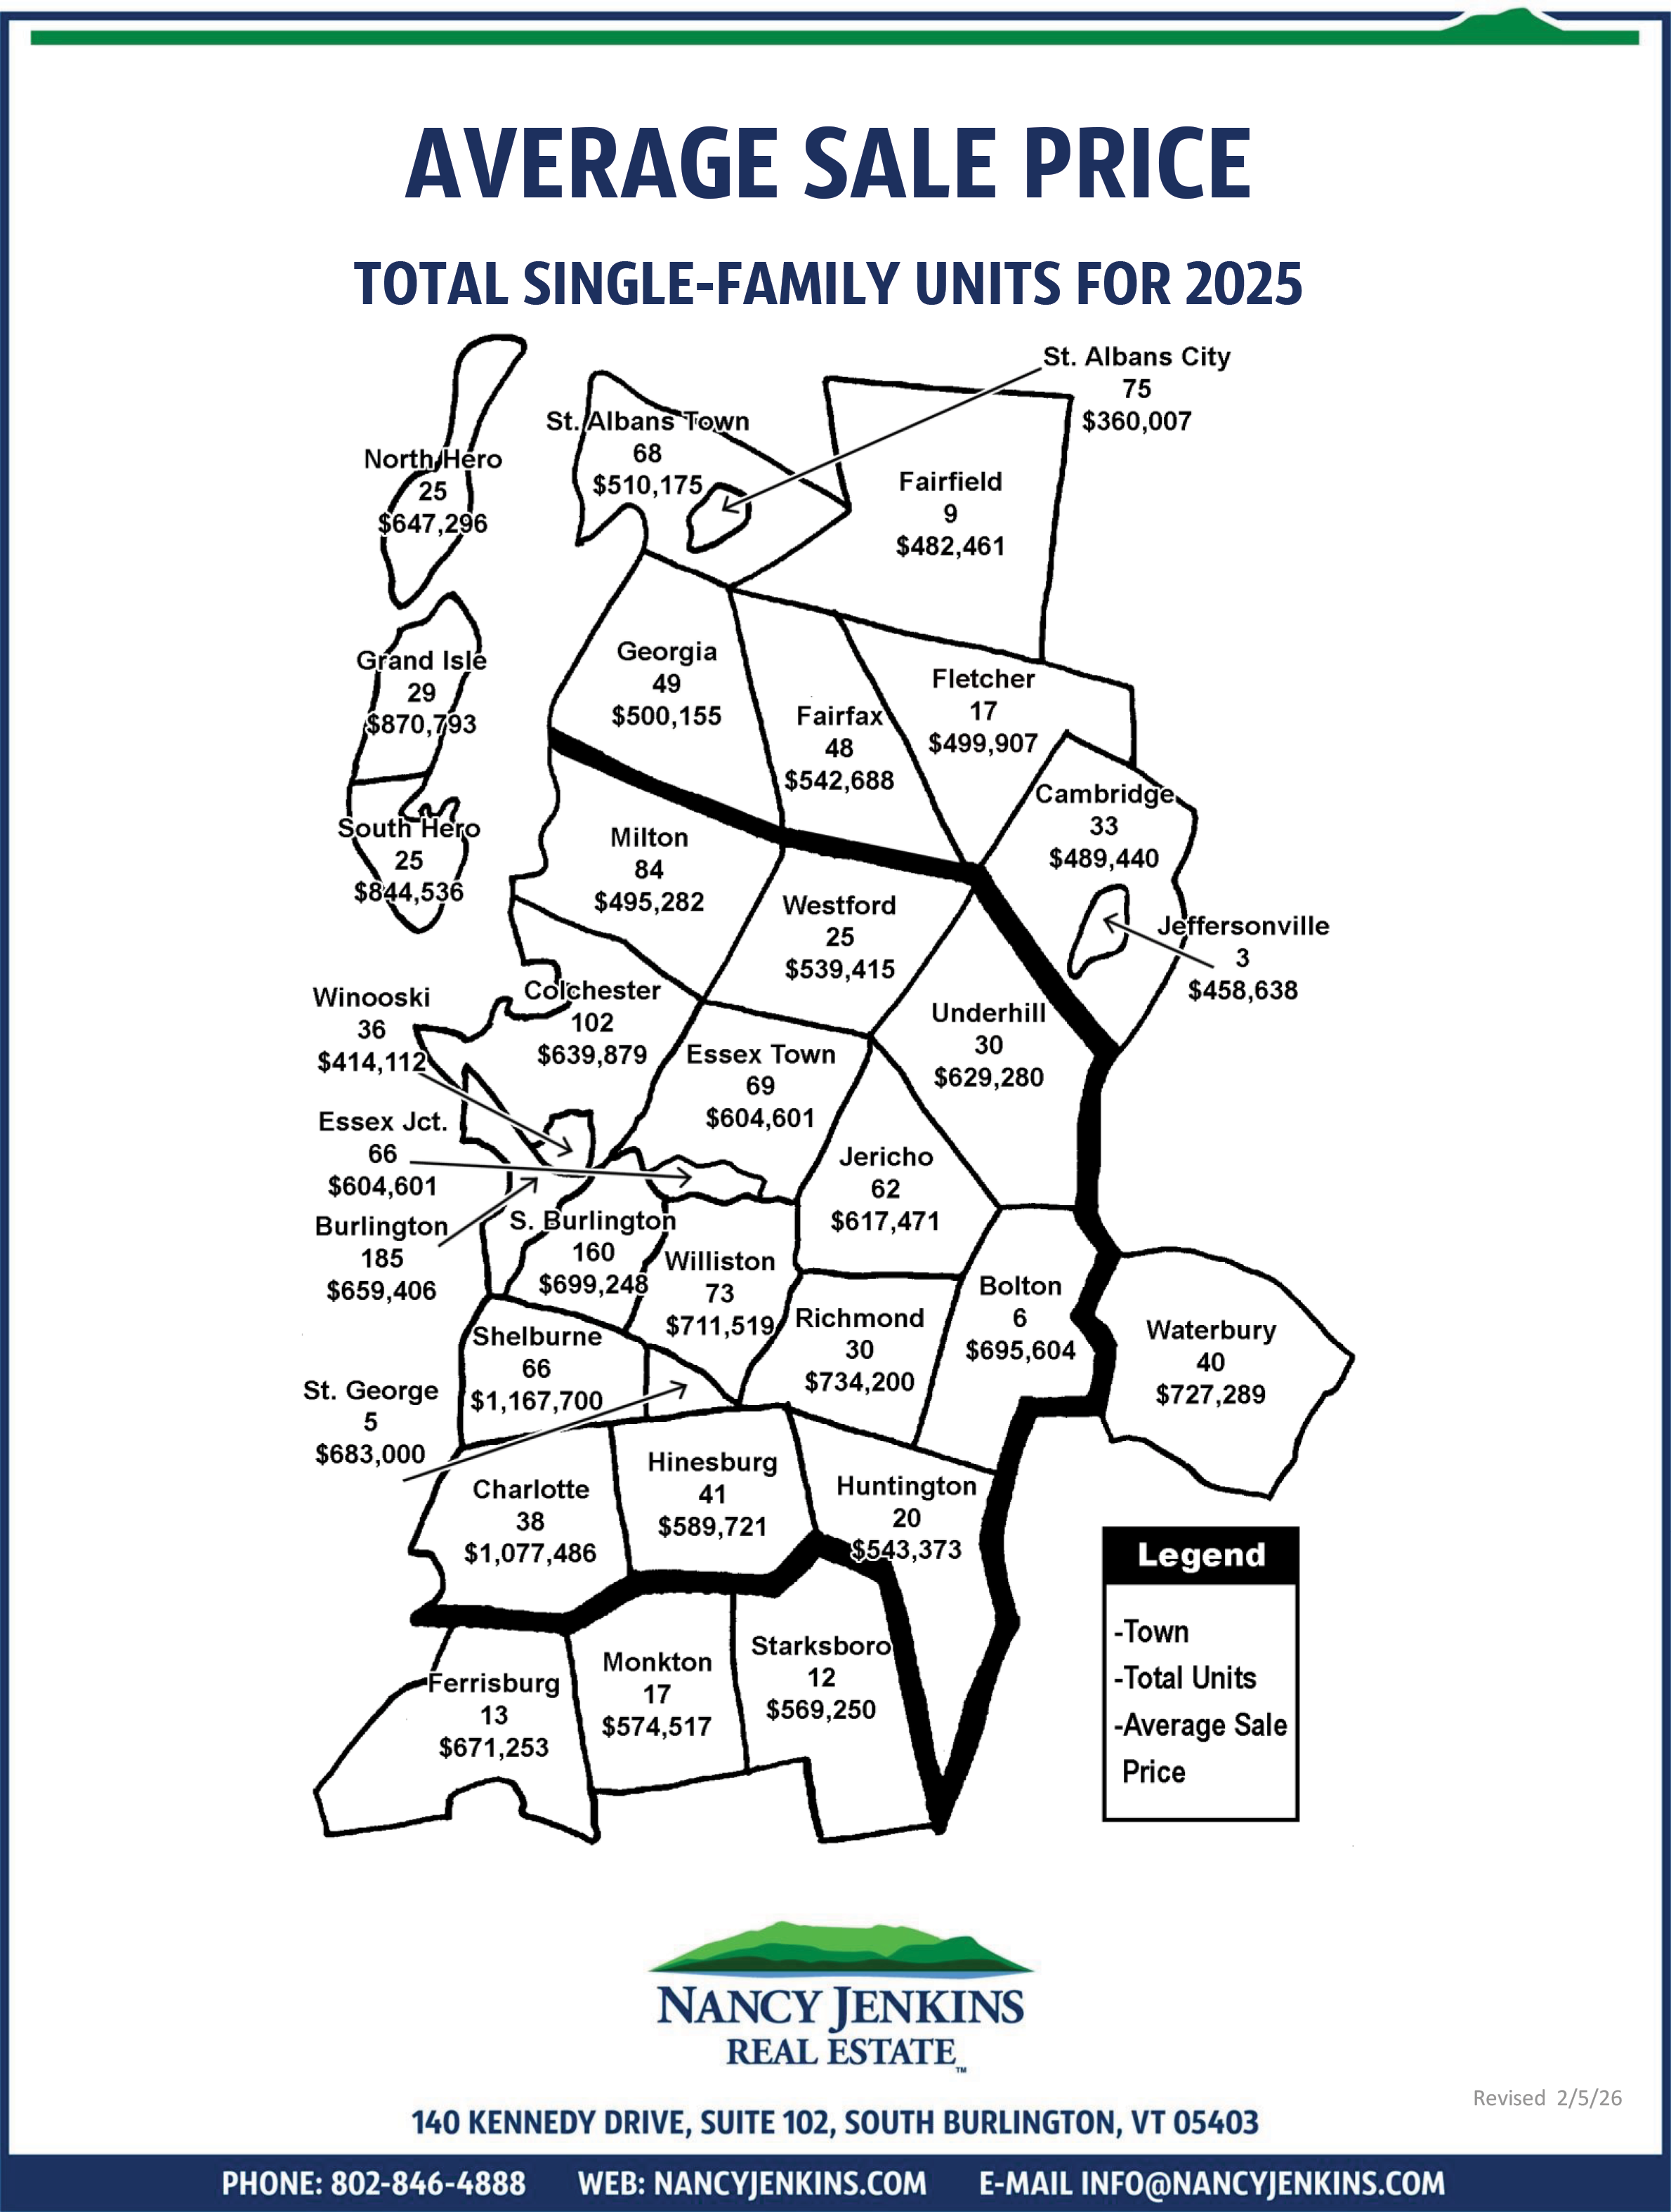
Vermont Average Sales Price Map
Please find the average sales price for each town along with the total number of closed single-family units for 2024.
Click Here to view our latest Vermont Property Statistics showing the total closed units for each town along with the average sales price, total volume sold and the list to sales price ratio.
As always, we are here to answer any questions you have about our market here in Vermont.
All date provided from NEREN.

Socials